
Application Insights will work for sure with .Net applications, either web or console. But what about the open source stack? What about node.js? The good news is that you can use Application Insights in your node.js application.
Why Application Insights?
With telemetry you are able to see usage statistics and diagnostic data about your application like never before. You gain the ability to detect issues earlier and take action as soon as they occur instead of learning about them from your users. You can see what features people use the most and focus your efforts there, where it pay. In short... you'll be able to be proactive and take better decision.
The best way to have success with your application is to have visibility over what is happening.
Note that Application Insights is still in preview at the time of writing this article.
Prerequisite: Ghost
This article assume you already have a Ghost blog configured, it can be hosted locally or on Azure. If you want to know how to host Ghost on Azure, there is a excellent article from Scott Hanselman about this topic. (See 'How to install the nodejs Ghost blog software' in the Reference section at the end of this post)
Configuring Application Insights for Ghost on node.js
You need to create an Application Insights account in Azure, to do so:
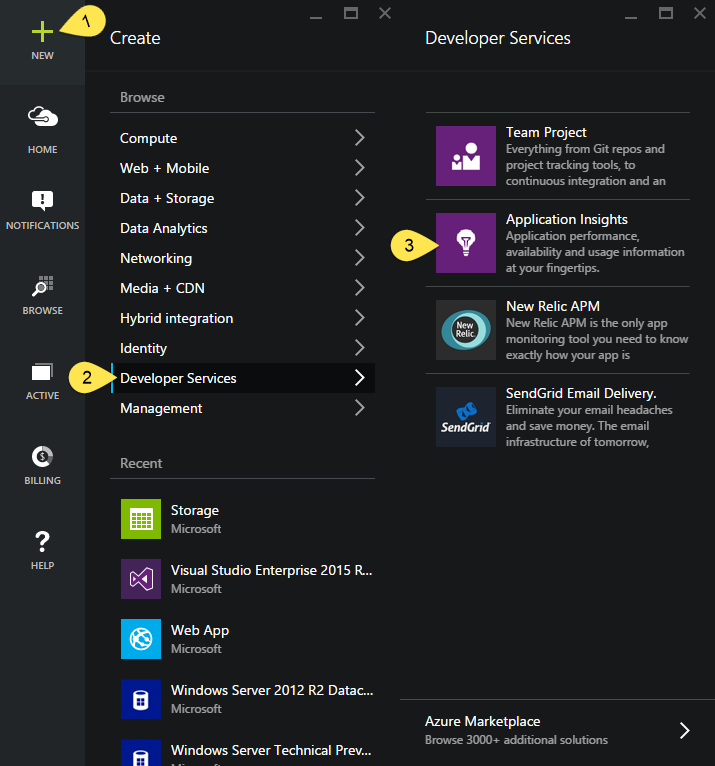
- Login to http://portal.azure.com and create a new Application Insights account.
- Click the New button, click the Developer Services category and choose Application Insights
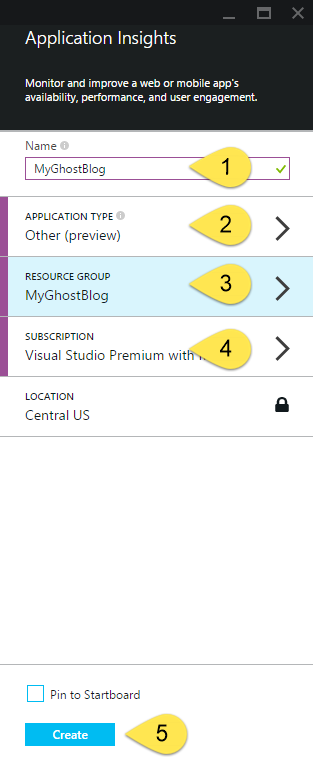
In the Application Insights blade that just appeared, fill the following:
For the name: Enter the name of your blog.
Application Type: Other (preview)
Resource Group: Choose an existing or create a new Resource Group
Subscription: Choose the target subscription
- Click the Create button
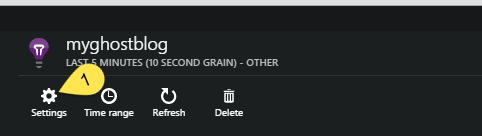
After your account is created, you'll need to find your instrumentation key.
- Open your account, go to Settings
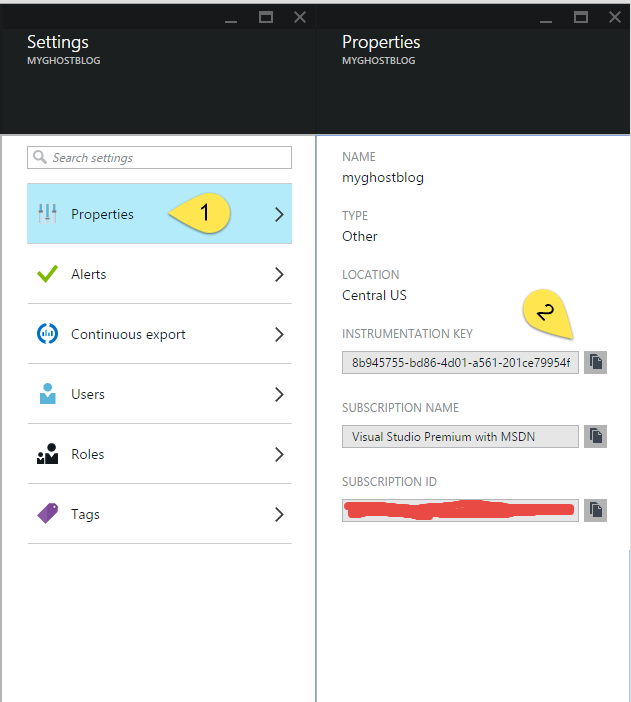
- Choose Properties, copy your Instrumentation Key and keep that information, we'll use it later.
I use the 'Git Push' deployment model. Meaning that all my changes are made offline and when I'm finished, I push the changes to my website for them to be deployed. You could also use the Kudu console to perform the following steps.
Now that you have Ghost installed and your instrumentation key, you need to install the Application Insights package with the following command (in your Ghost directory)
npm install applicationinsights
This will install the necessary files to use Application Insights with node.js.
Still in your Ghost installation folder, locate and open the file core/server/index.js.
Add this line AppInsights = require('applicationinsights'), right below GhostServer = requires('./ghost-server'),. Pay attention to the commas before and/or after your statement to ensure your Requires statements are well written.
Locate the middleware statement in the init function, and insert the following right below it: AppInsights.setup('YOUR INSTRUMENTATION KEY').start();.
It should look like this:
function init(options) {
  		...
  		// ## Middleware and Routing
  		middleware(blogApp, adminApp);
  		// Application Insights
  		AppInsights.setup('YOUR INSTRUMENTATION KEY').start();
  		...
}
Be sure to replace the string 'YOUR INSTRUMENTATION KEY' with your real instrumentation key that you copied from the Azure portal.
The next step is to get the monitoring code into your pages.
First, in your Application Insights account, click the Quickstart icon, click the Node.js tab and then click the arrow next to "Get code to monitor my web pages"
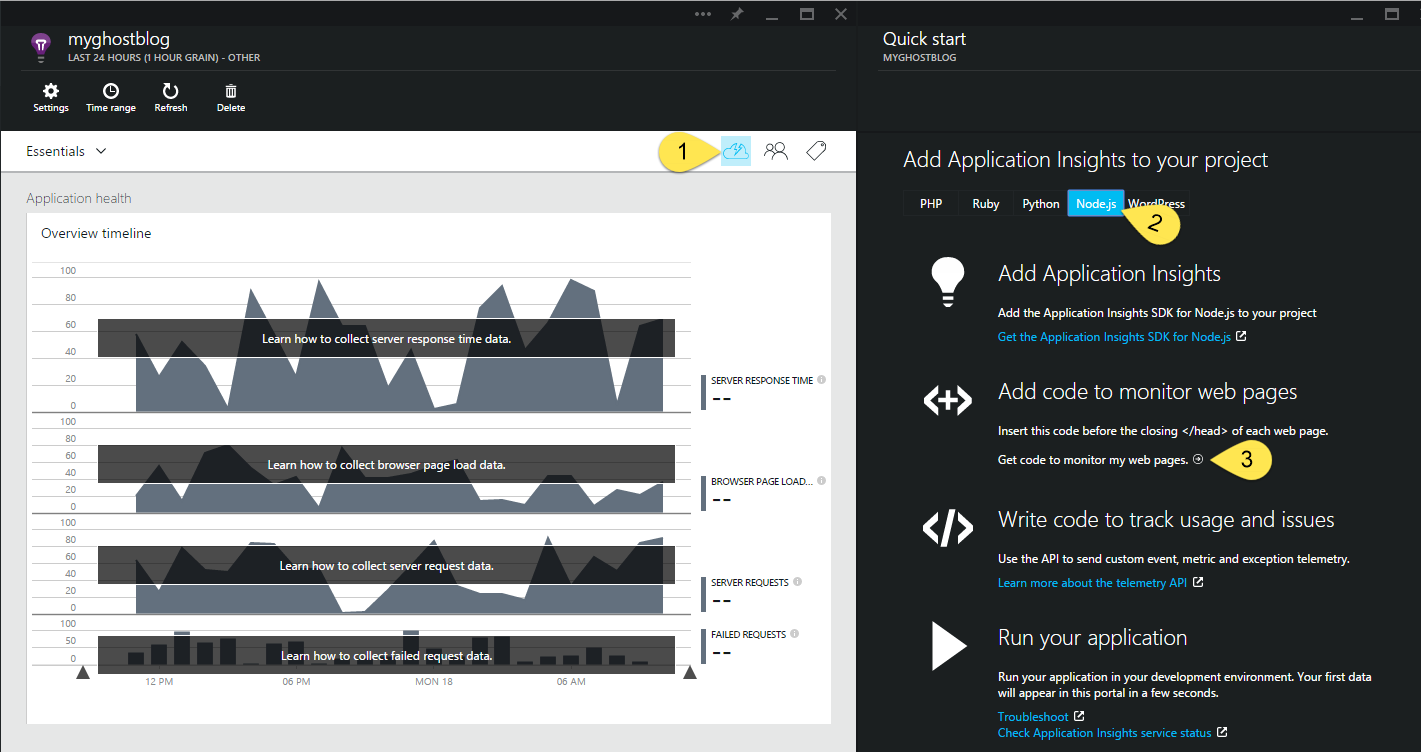
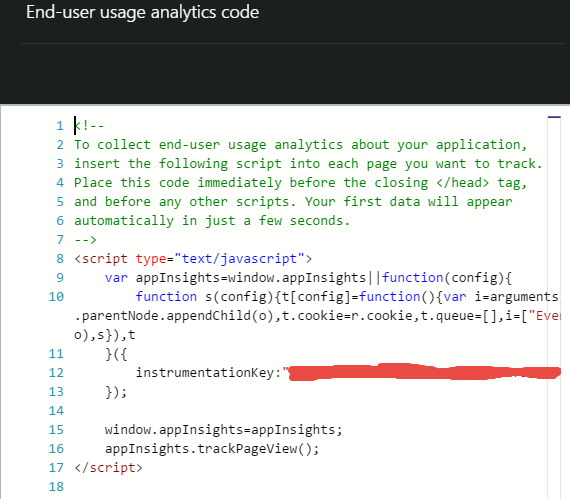
Select all the code from the new blade that just appeared and copy it.
If you use a newer version of Ghost that support Code Injection, please use it instead of editing your default.hbs file directly. Just paste the copied code into the Blog Header section and that's it. (more information on Ghost Code Injection in the Reference section)
If you use an older version of Ghost that don't support Code Injection, locate and edit the file content/themes/casper/default.hbs
Insert the copied monitoring code on the next line below the {{ghost_head}} statement.
It should give you something that look like this:
<head>
    ...
    {{ghost_head}}
  	<!--
	To collect end-user usage analytics about your application,
	insert the following script into each page you want to track.
	Place this code immediately before the closing </head> tag,
	and before any other scripts. Your first data will appear
	automatically in just a few seconds.
	-->
	<script type="text/javascript">
	    var appInsights=window.appInsights||function(config){
	        function s(config){t[config]=function(){var i=arguments;t.queue.push(function(){t[config].apply(t,i)})}}var t={config:config},r=document,f=window,e="script",o=r.createElement(e),i,u;for(o.src=config.url||"//az416426.vo.msecnd.net/scripts/a/ai.0.js",r.getElementsByTagName(e)[0].parentNode.appendChild(o),t.cookie=r.cookie,t.queue=[],i=["Event","Exception","Metric","PageView","Trace"];i.length;)s("track"+i.pop());return config.disableExceptionTracking||(i="onerror",s("_"+i),u=f[i],f[i]=function(config,r,f,e,o){var s=u&&u(config,r,f,e,o);return s!==!0&&t["_"+i](config,r,f,e,o),s}),t
	    }({
	        instrumentationKey:"YOUR INSTRUMENTATION KEY" // <-- You need to change this for your real Instrumentation Key
	    });

	    window.appInsights=appInsights;
	    appInsights.trackPageView();
	</script>
    ...
</head>
Save all the changes you just made (and push the changes to your website if needed). If you used Kudu to perform your modification, don't forget to restart your website from the console, otherwise your bootstrap code that kick the instrumentation won't run and you won't get any data out.
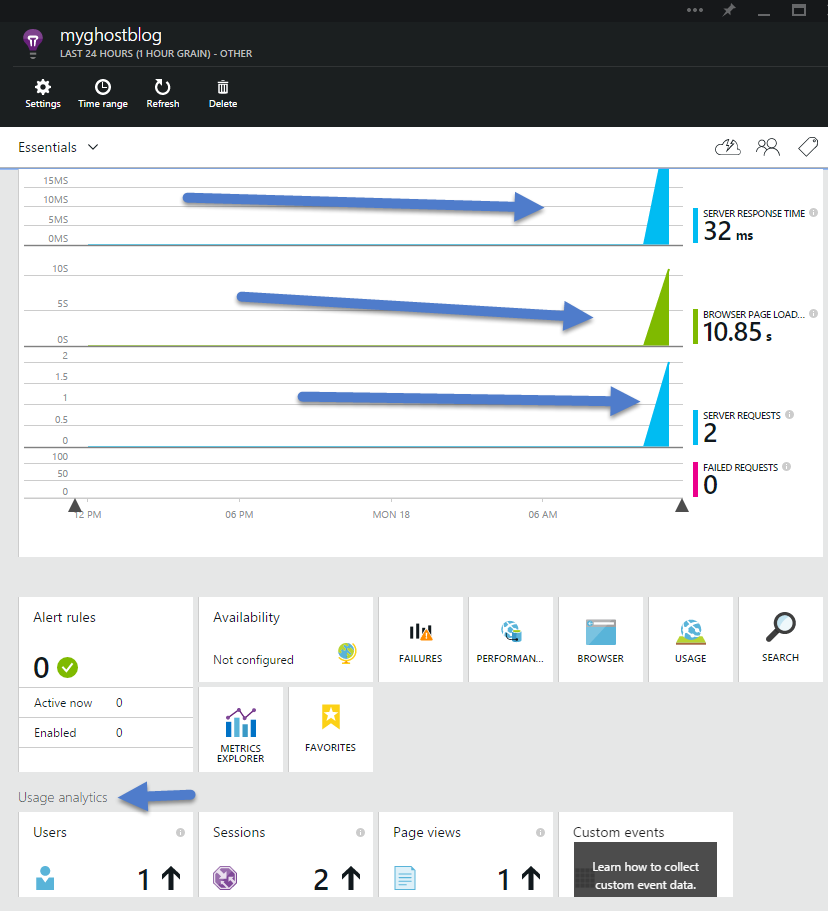
Browse your site around and you should see instrumentation data starting to appear in your Application Insights account after a minute or two.
This is just the tip of the iceberg. You have plenty of control over how auto-collection behave, you can create custom events, etc. Please read about Application Insights and his SDK, there is a ton of stuff to grab and learn, links are just below.
Have fun with telemetry, node.js and Azure!
Reference
- Ghost Blog engine
- UPDATED for 2015: How to install the nodejs Ghost blog software on Azure Web Apps (and the Deploy to Azure Button)
- Ghost Code Injection
- Get started with Visual Studio Application Insights
- Microsoft Application Insights SDK for node.js
- The Kudu Debug Console, Azure Websites best kept secret